 Control Tower
 Monitoring: Flights, Ledger, Inventory, metrics
Flights
Every request through the gateway — model calls, MCP tool calls and HTTP API calls — with its agent, target, outcome, tokens, cost and latency. Filter by errors, blocked, awaiting approval or rejected, or search by agent, model, tool, error or flight id. Model, HTTP API and A2A responses carry x-ct-flight-id (an MCP refusal carries flight_id in its text), so an agent's log line leads straight to its flight.
- ~ after the tokens: the provider didn't report usage, so it is estimated.
- cached under the cost: answered from Control Tower's response cache, with no call to the provider.
- trace by the flight id: the call is part of a chain of agents calling agents; it shows every call in the chain (Agents calling agents).
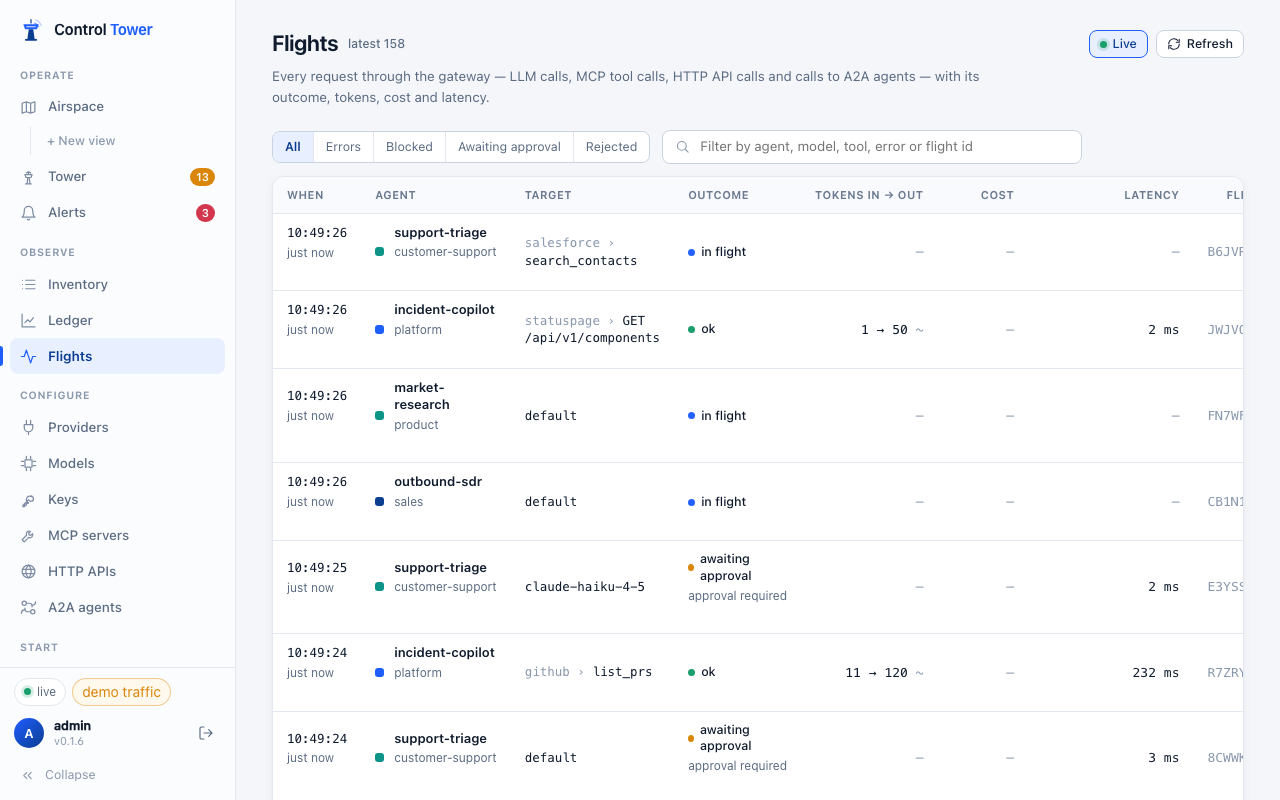
Prompts and responses are not stored: a flight records who, what, when, the outcome and the numbers.
Ledger
Spend, requests, tokens and errors over time, per agent and per model or tool server, for the last hour, day, week or month. Each flight is priced once, at the rate in force when it was routed; usage the provider didn't report is estimated and marked as such.
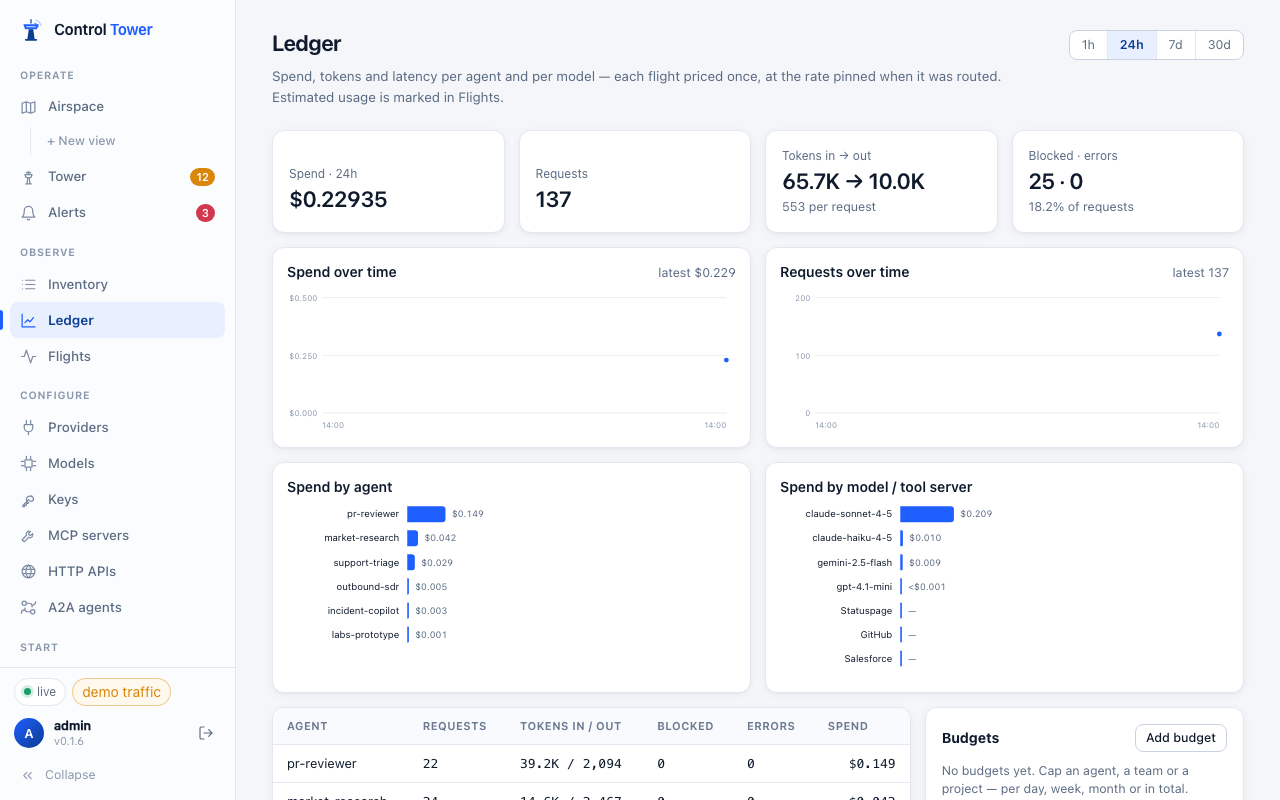
The Budgets card shows every agent, team and project budget against its spend, and is where team and project budgets are added — see Keys, budgets and limits.
Customers lists the end customers calls were made for, with their requests, agents, spend and budget; a customer can be named, blocked or given a budget there. Spend by tag breaks spend down by the tags calls carried. See Tags and customers.
Data-flow inventory
Inventory lists every agent, model and tool server, and every agent → model / tool path seen in the last 24 hours, 7 days or 30 days — with requests, errors, blocked, held and spend, and, for each path, what Control Tower does about it today: the access decision and the gate behind it, the inspect gates that scan it, and whether the agent's key even allows it. Paths seen outside the gateway are listed separately as seen, not enforced.
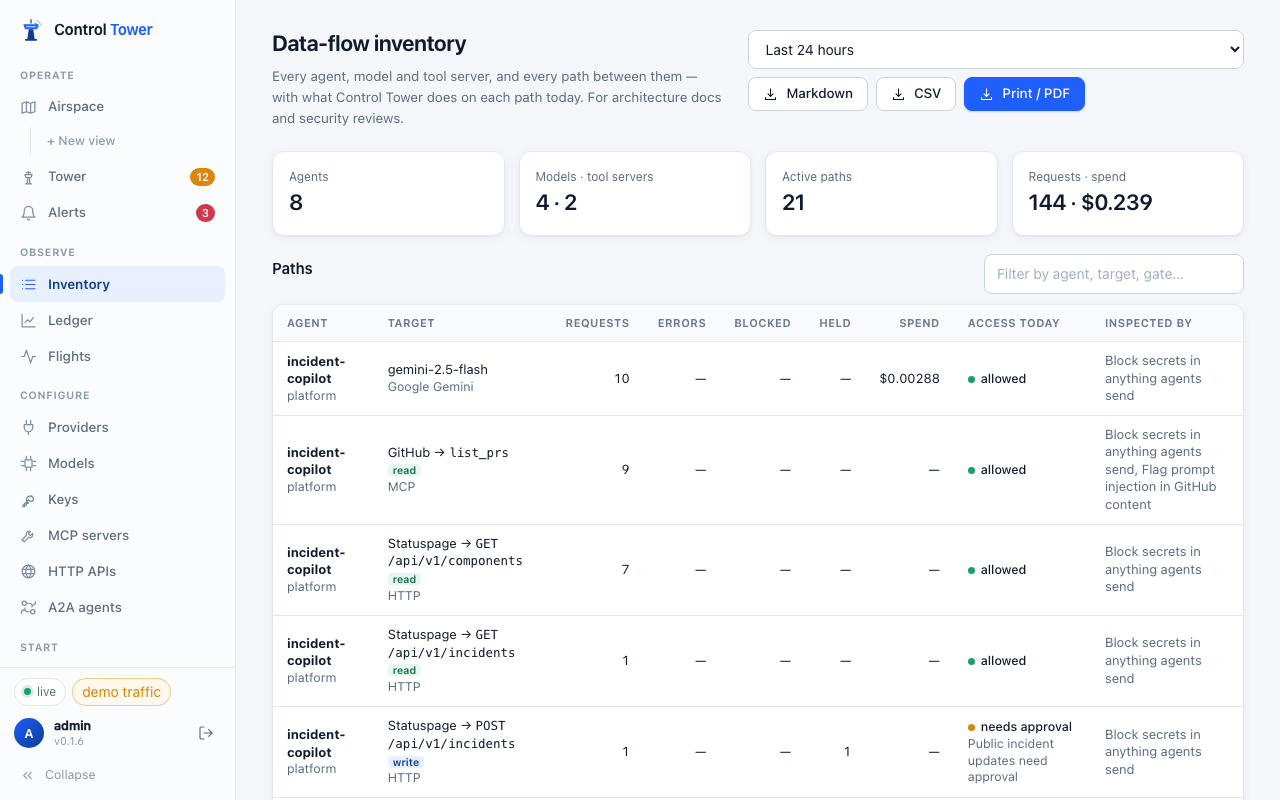
Print it (or save as PDF) for a security review, or download it as Markdown for a wiki or pull request, or CSV for a spreadsheet: GET /admin/api/export/dataflow?format=md|csv&hours=24. Airspace → Export → Map image saves the whole map as a PNG for architecture documents.
Prometheus metrics
GET /metrics serves the Prometheus text format. It names agents and shows spend, so it is never anonymous: set CT_METRICS_TOKEN and scrape with that bearer token. Anyone signed in to the console (viewers included) and the admin key can also open it.
scrape_configs:
  - job_name: controltower
    authorization: { credentials: <CT_METRICS_TOKEN> }
static_configs: [{ targets: ['controltower:4000'] }]| Metric | |
|---|---|
controltower_requests_total{agent,team,kind,model,provider,status} | Requests |
controltower_tokens_total{agent,model,type} | Tokens by type |
controltower_spend_usd_total{agent,team,model} | Spend |
controltower_delegated_requests_total{origin,agent,kind} | Requests made on behalf of another agent: origin started the chain, agent made the call |
controltower_delegated_spend_usd_total{origin,agent} | Spend made on behalf of another agent |
controltower_upstream_failures_total{model,code}, controltower_fallbacks_total{model} | Provider health |
controltower_gate_decisions_total{gate,decision}, controltower_approvals_total{outcome} | Enforcement |
controltower_request_duration_seconds{kind,model,provider}, controltower_time_to_first_token_seconds{model,provider} (streams), controltower_gateway_overhead_seconds | Latency histograms |
controltower_requests_in_flight, controltower_held_requests, controltower_event_backlog | Gauges: calls under way, calls waiting for approval, flight events not yet written |
controltower_deployment_state{model,provider} (1 = cooling down after failures), controltower_mcp_server_up{server} (MCP servers and HTTP APIs) | Gauges: health |
controltower_budget_limit_usd{scope}, controltower_budget_spent_usd{scope}, controltower_budget_remaining_usd{scope} | Gauges: each budget in its current period (scope is key:<key name>, team:<name>, project:<name> or customer:<id>) |
controltower_build_info{version}, controltower_uptime_seconds | Gauges: the build, and seconds since start |
Labels are bounded: a model name the gateway doesn't know is reported as other, so clients can't create series at will.
Health checks
/healthz and /health/liveliness for liveness, /readyz and /health/readiness for readiness, and /health (admin or agent key) to check every connected provider. /readyz answers {ok, shutting_down}; with the admin key it adds the event backlog, the database's write-ahead log size and the provider count. See Install.
Load testing
pnpm load:fleet (from a checkout) drives a fleet of agents against a running server and measures the gateway and the Airspace under that load. Point it at a server started in demo mode, so the models, MCP servers and HTTP API it calls are the built-in stand-ins and nothing leaves the machine:
export CT_ADMIN_KEY=sk-$(openssl rand -hex 32)   # the admin key for the test server
CT_DEMO=1 pnpm start

# in a second terminal, with the same CT_ADMIN_KEY exported
pnpm load:fleet --admin-key "$CT_ADMIN_KEY" --agents 1500 --rps 300 --duration 60
It creates --agents keys (named load-*, replaced on each run) across --types agent types (60) and --teams teams (12), a few big agents with many copies and a long tail of small ones. It then sends --rps requests a second — chat, MCP tool calls and HTTP API calls — and halfway through opens the Airspace in a headless browser. The report in load-report/ has:
| Traffic | Achieved rate, statuses, client latency, and gateway overhead from /metrics |
| Map | Time to first draw, topology size, stations drawn, frame rate, live updates per second and bandwidth by message type (as decoded; on the wire the WebSocket is compressed), memory |
A screenshot of the map under load is saved next to it. --no-browser skips the map.